Assessing who the greatest Tiger pitchers are seems like it would be a simple job. You take the best 3 seasons of the pitchers, average them together, and whoever has the most wins, lowest ERA, highest strikeout totals and innings pitched gets picked. The only problem is that differences in era (not earned run average in this case) are more glaring for the pitching position than they are for hitters. For example, we all understand the dead-ball era existed before 1920. This allowed hitters to have magnificent batting averages, but home run production was almost non-existent. From 1920 to 1930 we see the “live-ball” era begin, when home run production increased dramatically. 1930 to 1940 was considered the “rabbit-ball” era, when batting averages and home run production spiked even above the 1920s (not so much on an individual basis, but rather as a whole). These eras reflect on pitching, as a typical decent pitcher in 1910 could have an ERA of 2.50 (No ERA champion before 1920 posted an ERA above 2.00). This same pitcher in 1935 would have an ERA of about 4.00 (in 1938, Lefty Grove had the lowest ERA in the American League at 3.08).
Innings pitched and complete games are similarly affected by time period. Pitchers were expected to finish what they started until even the 1970s. Also, pitchers were known to pitch both ends of a double header during the first half of the 20th century, or pitch on 1 or 2 days of rest. Today’s pitchers are subject to strict pitch counts, and are given 5 days of rest whether they want it or not. In addition, relief pitchers are now considered specialists who get teams out of a specific jam at a certain point in the game. Before the 1970s, relief pitchers were mainly failed starters, or starters in waiting. Mariano Rivera would not have been a closer before 1970.
What all of this amounts to is that pure statistics are very deceiving when it comes to pitchers. Because of Sabermetrics, and other statistical measurements of productivity, the “win” has lost influence as a measuring stick for good pitching (this is why Felix Hernandez won the Cy Young award in 2010 with a 13-12 record). We know a bad pitcher can win a lot of games on a good team, but wins are difficult to use as a measuring stick when a good pitcher is on a bad team. There have been many good pitchers in history who lose a lot of ball games, but pitch well enough to give their team a chance to win. In the years when pitchers have lost 20 games in a season, fans and writers will often say that pitcher was “good enough to lose,” because even with the high number of losses, that pitcher gave the team the best chance to win at that given time.
With all of that being said, how can one possibly choose an All-Time Detroit Tiger pitching staff? I have 9 positions to fill, since I used 16 positions for batters. For the 9 pitchers I decided I would choose the 7 best starters, and 2 best relievers in team history. My criteria again requires at least 3 “productive” seasons, meaning that there must be 3 seasons with some measure of dominance for that time period. The pure numbers are not going to appear fair, because starting pitchers from 1980 on simply do not get the opportunities to win games as pitchers from previous years (in games started or innings pitched). Also, to restate what I said above, dominating the 1930s as a pitcher did not look the same as dominating the 1920s, or for that matter, the 1950s and 1960s. I will be using the “classic” statistics to measure greatness – Wins (Saves for Closers), Losses, ERA, Complete Games, Shutouts, Innings Pitched, and Strikeouts, but I will also be reflecting the pitchers by how dominant they were for their particular time period. For this I will us a modern stat – ERA+ (also known as Adjusted ERA). This stat measures the particular pitcher’s ERA against the league average with an adjustment made for how “hitter friendly” their own ballpark is, thus giving a fair comparison to the pitcher’s peers, and allowing for a comparable measurement across different eras of baseball history. An ERA+ of 100 means the pitcher exactly hit the average league ERA. The higher the ERA+ is the better the pitcher’s ERA compared to the league. An ERA+ of 200 is very difficult to achieve, but has been done about 20 times by starting pitchers throughout baseball history. I do want to note that I feel wins and innings pitched are very important, as it is the job of the pitcher to find a way to win regardless of the conditions they are in for the game or season. Beating another team’s best pitcher, or a team full of great hitters counts when it comes to making this list.
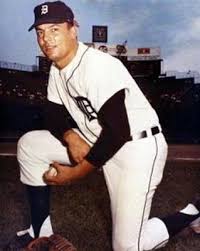
I will begin my starting pitchers with what many historians would consider an unfair selection, Hal Newhouser (L). I say it is unfair because Prince Hal had two amazing seasons when the best baseball players were overseas fighting WWII. This would appear to give him an unfair advantage, and maybe it did.
 None the less, Newhouser earned MVP honors in 1944 and 1945 (this was before Cy Young awards were given), won the pitching Triple Crown (Wins, ERA, and Strikeouts), and was the ace of the 1945 World Series winning team. He finished his career with 207 wins (200 with Detroit) and a 3.06 lifetime ERA, and earned his way into the Hall of Fame. I place him on this team, however, because 1944 and 1945 were not the only productive years he had (plus, being successful against lesser opponents does not make one a bad pitcher. He had to win those games with a lesser defense behind him, and weaker hitters on his own team too). When all the great hitters came back home, he had a stellar 1946 (with a sub-2.00 ERA), followed by excellent years in 1947, 1948 (leading the league with 21 wins), and 1949. His success was no fluke. His career is closer to the great Sandy Koufax than any other pitcher in Tigers history, since Newhouser, like Koufax, was a late blooming lefty who went from mediocrity to dominance seemingly overnight.
I want to point out that the year Newhouser’s ERA increased to 2.22, he finished second in the league. Also, in 1948, Prince Hal’s ERA was fourth in the league, and the average ERA for the league that year was 4.28 (while the other three years on this list had a league ERA between 3.36 to 3.50).
The second pitcher chosen has already reached legendary proportions, even though he still has a long way to go in his career. Justin Verlander (R) is possibly the hardest thrower of his era, consistently reaching 100 mph on the radar gun even into the 8th and 9th inning of games. Verlander is so effective not just because he throws hard, but he also features one of the best curve balls in baseball.
|
|
|
|
|
|
|
|
|
|
|
|
|
|
|
|
|
|
|
|
|
|
|
Cy Young, MVP, Triple Crown, AS
|
|
|
|
|
|
|
|
|
|
|
|
|
|
|
|
|
|
|
|
|
|
|
|
|
|
|
|
|
|
|
|
|
|
|
|
|
Although Verlander’s 2009 season appears a bit out of place with the higher ERA, I feel it needs to be pointed out that his was the sixth best for a starting pitcher in the American League that year. His 2012 total was second in the American League to Cy Young award winner David Price.
The next pitcher chosen is the only Tiger to win two Cy Young awards to date (although Newhouser would have undoubtedly won three had the award been given in his day, and seriously challenged for a fourth. Plus, Verlander is not done yet), but had injuries shorten his career. His numbers year in and year out could be confounding, because he showed inconsistency in his performance. Some of that could be blamed on mediocre teams, some of it maturity, some of it injuries. Any way you cut it, Denny McLain (R) deserves to be on this team based on his performance as a pitcher in the mid to late 60s, and his role in helping Detroit win their third World Series title in 1968. That year he won an astounding 31 games, pitching 336 innings, compiling an ERA of 1.96, and along with the Cy Young award, he also took home the American League MVP. Many people will call me to task for placing McLain on the team, and leaving off Norm Cash earlier. This would be a fair argument, except McLain led the league with 24 wins in 1969, and notched his second Cy Young award. In 1970, after facing numerous suspensions for gambling and other unbecoming behavior, McLain only went 3-5. In 1971, he had arm trouble, and his record dropped to 10-22. By 1973, at the age of 29, he was out of baseball.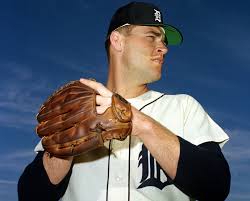
Before 1968, Denny had another 20 win season, when his record was 20-14 in 1966. During his time with Detroit, he compiled 117 wins against 62 losses, for a winning percentage of .654. That’s pretty impressive, especially when you consider that this includes his 10-22 campaign in 1971. He was not quite the work horse in 1965 or 1966 he became in 1968 and 1969 (although by today’s standards, he threw a lot of innings), but if he had stayed at this level, his arm might have lasted longer. Still, McLain played a key role for the 1968 World Series team. Although he went 1-2 and in the 1968 World Series itself, he won a crucial game 6 on two days rest to force a game 7.
McLain benefitted from good hitting in 1966, when his ERA was twenty-seventh among starting pitchers in the American League (and higher than the league average of 3.44). Still, he showed durability by throwing 264 innings, and gutting out 20 wins. In the three other seasons his ERA was well below the league average, as he finished 1968 fourth in the ERA race (the league average that year was 2.98), and seventh each in 1969 and 1965.
The fourth pitcher spent his entire career in Detroit from 1930 to 1946, being on the roster for four pennants and two World Series championships. He was the ace of the staff in 1934 and 1935, and the number two starter in 1940. He only saw action in 4 games in 1945 (coming back late in the season after his service in WWII), so his role was not crucial to that team’s success. He did pitch in game 6 of the World Series, however.
Tommy Bridges (R) numbers might appear deceiving. He won 194 games in his career against 138 losses (.584 winning percentage), and had an ERA of 3.57 for his career. His career spanned a time when hitters seemed to have the advantage, resulting in league ERAs frequently topping 4.50 (with the 1936 American League ERA at 5.04). In fact, in each season listed he was in the top 10 of the league in ERA. In 1936, his ERA was fourth best in the league; 1935 was sixth best; 1934 was ninth best, and 1939 was eighth best. He made six All-Star teams in his career.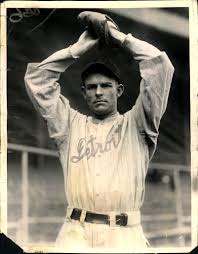
Bridges went 1-1 in the 1934 World Series, losing game three to Paul Dean, but beating Dizzy Dean and the Cardinals in game five 3-1. In the 1935 World Series against the Cubs he went 2-0, completing both of his starts, and clinching the series in game six, after retiring the side in the 9th inning of a 3-3 game with a runner on third, and nobody out. The Tigers scored in the bottom of the 9th to win their first title in franchise history.
Bridges won 20 games in a season three times in his career, and was among the league leaders in strikeouts on a frequent basis. He held the team record for career strikeouts until Hal Newhouser broke it in 1951. Jack Morris would later break Newhouser’s record in 1988. Bridges also missed three seasons due to military service. If not for this, he would have certainly won over 200 games, and possibly seen election into the Baseball Hall of Fame.
The next pitcher was the ace of the Tigers’ pitching staff from 1979 to 1990. Jack Morris (R) won more games and pitched more innings than any pitcher in the 1980s. He was the anchor on the pitching staff that won the 1984 World Series and 1987 Eastern Division title. His pitching repertoire featured a mid-90s fastball, hard slider, and the best forkball in the league. He had two seasons of twenty wins with Detroit, a nineteen win season, an eighteen win season, and two seventeen win seasons. He was on pace to win 20 games in 1981, but the strike shortened the season to 109 games, and Morris ended the year with 14, which led the league (I would use that season for his prime season calculation, but could not come up with a fair way to calculate this with the others, so it was omitted). He finished his tenure with Detroit two wins shy of 200, and for his career he ended up with 254 wins (42nd all-time).

Jack often gets criticized from a historic standpoint, because his ERA appears higher than dominant pitchers who came before him. The criticism is that Morris won because he happened to be a good pitcher on teams with a great offense. This isn’t quite fair, because 1) offenses changed in the 1980s and 1990s, which resulted in higher league ERAs than the 1960s and 1970s, and 2) Morris consistently finished in the top 5 in innings pitched, and the top 10 in ERA each year. He also struck out over 200 batters per year, leading the league in this category in 1983, and finishing his career thirty-second on the all-time strikeout list, just shy of 2,500. He earned every win he had as a Tiger.
Tiger fans will remember and appreciate the role Morris played on the 1984 club. He won 19 games to lead the team (including throwing a no-hitter) for the season. In the playoffs he won his only start in the ALCS as the Tigers swept the Royals, then went on to go 2-0 in the World Series, pitching complete games in both of his starts, and giving up 4 runs in his 18 innings of work.
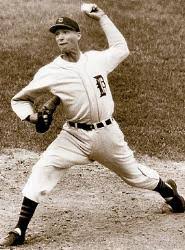
I kept trying to exclude this next pitcher from this team. He was not the ace of the staff when he played, and his win-loss record always seemed to hover just above .500. His 14 year record with Detroit was 161-153, and his career record was 170-161. Given all that, he was too good to leave off this team. He helped Detroit win the 1945 World Series, going 1-1 in the series itself, but posting an ERA of 0.66. This was the reason he earned a place on this team – every year Dizzy Trout (R) logged a lot of innings, finished near the top of the league in ERA, and did everything he could to help Detroit win games, including pitching in relief between starts and hit (he’s 11th all-time in home runs by a pitcher with 20). This is the kind of player anybody wants on their team.
 Trout is the rare exception whose record does not necessarily reflect the talent. He won 20 games twice in a season (leading the league in 1943 while pitching on a .500 team), made two All-Star teams, and finished second in the MVP vote to teammate Hal Newhouser in 1944. Notice when you see his prime numbers that only Verlander and Newhouser have a higher ERA+ than Trout on this team. That’s what turned out to be the deciding factor when creating this roster. You simply couldn’t ask more out of a pitcher than Trout gave.
|
|
|
|
|
|
|
|
|
|
|
|
|
|
|
|
|
|
|
|
|
|
|
MVP Runner-up, AS (9 relief G)
|
|
|
|
|
|
|
|
|
|
|
|
14 relief appearances, 6 saves
|
|
|
|
|
|
|
|
|
|
|
|
6 relief appearances, 3 saves
|
|
|
|
|
|
|
|
|
|
|
|
10 relief appearances, 2 saves
|
|
|
|
|
|
|
|
|
|
|
|
10 relief appearances, 3 saves
|
Initially when I came up with the list of pitchers I only wanted to list six players who were predominantly starters in their careers, while giving the other three places to relief pitchers. After debating with myself on it, I felt I needed a seventh, against only two relievers. To top it off, I chose for my seventh starter a player who never led the Tigers to the playoffs, and only had 123 wins for Detroit (128 for his career). Frank Lary (R, R) makes this team for posting great seasons on some very mediocre teams. “Mule” pitched for Detroit from 1954 to 1964, when the New York Mets purchased his rights. He was the ace of the 1961 team, which won 101 games, but lost the pennant to the Yankees. In that season he won 23 games and finished third in the Cy Young vote, behind Whitey Ford and Warren Spahn (before 1966 only one Cy Young award was given per year).
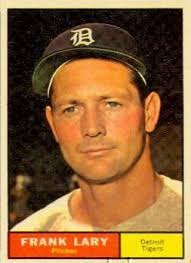
Most impressive about the Frank Lary resume is that from 1955-1961, when the Yankees won six AL pennants, Lary posted a 27-10 record against the Bronx Bombers. This earned him the nickname “Yankee Killer.” He won twenty games twice – the first season was in 1956 when Detroit finished fifth (out of 8 teams) in the AL. He led the league with 21 wins and 294 innings pitched, and finished sixth in the league with a 3.15 ERA. He also led the league in innings pitched in 1958, and finished fourth in ERA, despite only having a 16-15 record on a .500 team.
Before I defend those picks, I want to give the two relief pitchers I chose for this team. The first is, in my estimation, the greatest relief pitcher in Detroit history. John Hiller (L) played for the Tigers from 1965 to 1980, and at the time of his retirement pitched in more games (545) than any other Tiger pitcher. He also had 125 career saves, which was later surpassed by Mike Henneman and Todd Jones.
The difficulty of measuring Hiller’s performance over his career is that the 1970s was a transitional time for relief pitchers. It is not unusual to see a closer save 30 or 40 games in a season now, but when Hiller saved 38 games in 1973, this was a Major League record. Dan Quisenberry broke the record ten years later. In 1974 Hiller set the American League record for wins by a relief pitcher with 17. His role was not to come in for one inning and close out a game, but rather to come in whenever he was needed, which could be any inning of a game, and keep the team close, or stop the opposition from scoring any more runs. John Hiller was a master in these situations, retiring with an ERA of 2.83, while typically logging 120+ innings per year. Most impressive is that Hiller’s best seasons came after he had a heart attack in 1971.
In addition, Hiller appeared in thirty-nine games throughout the 1968 season, posting a 2.39 ERA, and pitched in two games in the World Series. He also played a key role down the stretch in 1972, helping the Tigers win the Eastern Division.
With only one position left on this team, and four deserving players, I was again left with a difficult choice. In 2012, Jose Valverde (R) completed his three year stint with the Tigers. He helped Detroit make the playoffs twice, and in 2011 he led the league with 49 saves, on 49 chances. Unfortunately, his inability to pitch effectively in the 2012 playoffs left a stain on his record, and is the ultimate reason why I could not choose him for this spot.
Before Valverde, the most prominent closer was Todd Jones (R), who had two stints as a Tiger closer, from 1997-2001, and 2006-2008. He finished his stint in Detroit with 206 saves, the current team record. He also helped the Tigers make the 2006 World Series, saving 37 games. I wanted to make a place for him on this team, but even though he produced big save numbers, his ERA always hovered in the high threes, which you can’t have from a closer position. Jones seemed to lack the dominance you expect out of a one-inning, shutdown closer.
Before Jones broke the team record for saves, the record was held by Mike Henneman (R). Henneman pitched for Detroit from 1987 to 1995, when he was traded to Houston. He racked up 154 saves, relying on his forkball. He took over the closer position in late 1987, saving seven games and helping the Tigers surge late in the season to win the Eastern Division. I would have placed Henneman on this team, but the fact that his Tiger teams never made the playoffs other than 1987 meant I could not justify putting him on the team ahead of the other closers in team history.
With that, the closer I selected for the All-Time Tiger team is Willie Hernandez (L). With the screwball as his out-pitch, Hernandez posted exactly three productive years with the Tigers before losing his effectiveness in 1987, having modest success in 1988, and being released in 1989. Still, Hernandez was the final piece needed to help Detroit win the World Series in 1984. He was traded to the Tigers from the Phillies before the 1984 season, and immediately took the closer role. That year he pitched in an incredible 140 innings in 80 games, winning 9, saving 32 (in 33 chances), and posting an ERA of 1.92. He won the Cy Young award and the American League MVP. He also pitched five innings in the World Series, saved two games, and yielded one run. He was on the mound when the Padres recorded their last out for the series.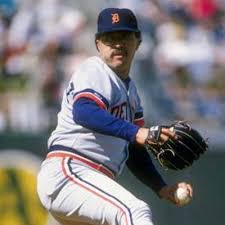
Hernandez followed in 1985 with 31 saves and a second All-Star appearance. In 1986 he posted 24 saves, and notched his third All-Star appearance. The mid-1980s was just before teams figured out how to properly utilize closers, because in today’s game, no closer would log even 100 innings, yet Hernandez did that twice for Detroit. This over-use is probably the reason he lost effectiveness so quickly in 1987. Still, his later years with Detroit do not diminish his dominance as a closer for three incredible years.
That concludes the roster of the All-Time Detroit Tiger team. I did want to take the time to mention the starting pitchers who missed the cut of this team, however. The criticism I will probably get is that I left off the three pitchers who posted the most wins in team history, and I did. I could also get the criticism that I didn’t place a pitcher before the 1930s on this team, not to mention a pitcher from the 1907 through 1909 seasons, when the Tigers won three American League pennants. I feel justified in my choices, but will take the time to explain.
The first pitcher I snubbed is Hooks Dauss (R), the pitcher who has the most wins in team history with 222. He pitched his entire career in Detroit from 1912 to 1926. His nickname comes from his use of an excellent curveball. Dauss pitched for no pennant winners during his tenure, although the 1915 team won 100 games, finishing one game behind Boston for the year. That year Dauss had his best season, winning 24 games, posting a 2.50 ERA, and even finding time to make eleven relief appearances. Those numbers today would win a Cy Young award, but in 1915 a 2.50 ERA was just a little below the league average, which was 2.93. Dauss finished fifteenth among starting pitchers for ERA that year (the middle of the pack in an eight team league), which makes his numbers look less impressive. This would also be the highest position he would finish in terms of league ERA for his career. In the end, Dauss had a rubber arm, and won a lot of games on the back of the best hitters in the league, Ty Cobb and Harry Heilmann, but he was not very dominant.
The second pitcher I left off was the ace of the early pennant winning teams, and is second in team history in career wins, with 209. George Mullin (R) was another pitcher who could throw 300 innings per year, and still come back for more. His best season was 1909, when he led the league with 29 wins for the pennant winning Tigers, and had an ERA of 2.22. Again, by today’s standards these numbers look amazing. Mullin’s ERA was 17th in the league that year, out of 34 starting pitchers who qualified based on innings pitched. Mullin finished in the top ten in ERA one time, in 1903. Beyond that, he hovered around the league average in ERA for his career, posting a career ERA+ of 101 (remember 100 is exactly the league average). Like Dauss, I feel he doesn’t deserve a place on this team because I cannot see any dominant seasons he had as a pitcher.
The pitcher with the third most wins in team history (207) is the one most people will feel deserves a place on this team. His 1968 World Series performance alone makes him a Detroit legend, going 3-0 with three complete games, and a 1.67 ERA, including his classic performance in game seven, when he outpitched Bob Gibson on two day’s rest. Mickey Lolich (L) was the number two starter behind Denny McLain in 1968, winning seventeen games. In 1970 he became the ace of the Tiger staff, and had career years in 1971 and 1972, while anchoring the team on to the 1972 Eastern Division title. Here is what his prime season would look like (using his top four seasons):
The pure numbers suggest that Lolich is clearly a better pitcher than Frank Lary. His prime season consists of more wins, a lower ERA, more innings and more strikeouts. However, Lary twice led the league in innings pitched, while Lolich only accomplished this once. The ERA+ is in Lary’s favor as well (128 to 121). Again, we have to look at time period to determine who was more dominant, not just the pure statistics. Even though their careers overlapped (in 1963 and 1964), hitters dominated in the late 1950s and early 1960s (especially the expansion year 1961). 1968 was considered “the year of the pitcher” because of the pitching records which fell in that season (Denny McLain’s 31 wins, and Bob Gibson’s 1.12 ERA both occurred that season). In 1958 Frank Lary was fourth in the AL in ERA with a 2.90 (with an ERA+ of 139). In 1971, when Lolich posted an ERA of 2.92 (with an ERA+ of 124), he finished tenth in the league. Similarly, in 1972 Lolich had an ERA of 2.50 (with an ERA+ of 127), and this again was tenth. In 1956, Lary had an ERA of 3.15, which appears high, but was sixth in the league (and yielded an ERA+ of 132).
Where I might get called out on this one is that Lary never played for a pennant winner, and that is fair. Frank Lary was the ace of a team which won 101 games, however. Plus, his success against the great Yankees teams of the late 1950s and early 1960s shows me that Frank Lary was a clutch performer. Lolich did manage to help the Tigers make two post season appearances. In 1968 Lolich was clearly not the ace of the pitching staff, Denny McLain was. Is this a knock against Lolich? No, and yes. The Tigers don’t win the World Series without Lolich, but they don’t make the World Series without McLain.
In 1972 Lolich was the best pitcher on a playoff team. That Detroit Tiger team finished with the third best record in the AL (86-70), behind both Oakland and Chicago (and both in the Western Division). Frank Lary’s 1961 Tiger team had the second best record in the AL, and they won 101 games, but because of the rules of the day, they could not make the playoffs (and still would not have under the 1972 rules, because they were in the same division as the Yankees, who won the 1961 pennant). I challenge anyone to show me how the 1972 Tigers were better than the 1961 Tigers. This was a close decision, one which I have gone back and forth on, but I do feel that Frank Lary was the better pitcher than Lolich.
The next pitcher who was left off was a key component of the 1934 and 1935 teams, along with making a large contribution to the 1940 pennant winning team. Schoolboy Rowe (R) was a very popular player in his day, and a helped give a formidable 1-2 punch along with Tommy Bridges. His best season was in 1934, when he posted a 24-8 record, with a 3.45 ERA (good for sixth in the league). He won 19 games in 1935, and another 19 in in 36. Here is what his prime season would look like (using his top four seasons):
Each of Rowe’s numbers are just slightly behind Tommy Bridges. Rowe’s ERA appears high, but his ERA+ is just below that of Jack Morris, and just above Mickey Lolich. Rowe gave a lot of innings, pitched in relief when needed, and became a fan favorite with his easy going, friendly manner. He just misses making this team, however, because Bridges edges him out in each category.
The last pitcher I left off this team is actually a Hall of Fame pitcher. He started with the Tigers, before coming into his own with the Phillies in the National League. Over his career he pitched two no-hitters (one being a perfect game), and at his retirement he had the second most strikeouts in Major League history with 2,855 (it now stands as 17th). He won 224 games, 118 with Detroit. Jim Bunning did not make this team, because I felt his accomplishments were overshadowed by Frank Lary, who was hit teammate from 1955 to 1963.
He and Frank Lary provided a potent 1-2 punch, and their numbers are very similar over this span. Bunning had one monster year in 1957, where he led the league with 20 wins, and had the third best ERA in the league at 2.69. Beyond that season, Frank Lary was the dominant pitcher on the team. In the 1961 season, when Detroit won 101 games, Bunning managed a 17-11 record, with a 3.19 ERA. If Bunning had his best years in baseball as a Tiger, he would get stronger consideration, but as it stands, he is known more for his years with Philadelphia, and rightfully so.
I am sure many people would disagree with my choices. I challenge anyone to come up with their own criteria for selecting a team, and then go through the process of actually picking their All-Time Detroit Tiger team. Or, better yet, pick a different team to do this with. I would love to compare this team to other teams in Major League baseball.
Up Next: Batting Order and Pitching Rotation
